
Below are the number (mn = million) of people estimated to have ever used four prominent drugs followed by the government estimate of the number and percentage who met the definition of abuse or dependence (A or D) in 2009.
| Alcohol | 220 mn | 18.6 mn | 8% |
| Cocaine | 37 mn | 1.1 mn | 3% |
| Heroin | 3.7 mn | 0.4 mn | 11% |
| Marijuana | 104 mn | 4.3 mn | 4% |
"Among year-before-last initiates of specific substances, over two thirds of crack cocaine, inhalant, and heroin initiates did not use the drug in the past year."
Quit use entirely within one year of first trying
| Crack | 76 % |
| Heroin | 69 % |
| Stimulants (meth) | 59 % |
| Cocaine (not crack) | 57 % |
| Pain relievers | 57 % |
| Marijuana | 42 % |
| Alcohol | 24 % |
http://www.oas.samhsa.gov/2k8/newUseDepend/newUseDepend.htm
2. Substance use disorder (SUD) or "addiction" is dominated by alcohol use disorder (AUD). About 68 percent of current cases are alcohol alone and 12 percent are AUD comorbid (simultaneous) with other drugs. Another 13 percent have a previous history of comorbid AUD. Alcohol is a major factor in about 95 percent of all cases of SUD. The drug effects of alcohol are the worst of any drug in terms of many important effects on others, including the victims of alcohol induced violent behavior, damage to the fetus and the loss of mental and physical control that contributes to so many rapes, assaults and accidents.
In 2010 the National Institutes of Health (NIH) said that alcohol is just another drug, quite similar to prohibited drugs. Alcohol causes the most problems and is most closely linked to brain and organ damage, violent and uncontrolled behavior and damage to the fetus. They declared their intent to unify the study of alcohol and other drugs.
" ... similar risk factors are associated with use and abuse of drugs and alcohol, and similar behavioral therapies and prevention strategies can be employed regardless of substance ... [separation] perpetuates the misconception, especially among youth, that alcohol is not really a drug. Therefore, one benefit of [unified study] is to develop a clear public health message that alcohol has similar detrimental effects on the brain and body as illicit drugs."
The full report includes input from NIDA and NIAAA.
REPORT ON SUBSTANCE USE, ABUSE, AND ADDICTION RESEARCH AT NIH
In 2009, an estimated 8.9 percent of persons aged 12 or older were classified with abuse or dependence in the past year.
| Total | 22.5 mn | % of total |
| Alcohol | 18.6 mn | 83% |
| Cocaine (includes crack - 2%) | 1.1 mn | 5% |
| Heroin | 0.4 mn | 2% |
Substance Dependence or Abuse in the Past Year among Persons Aged 12 or Older: 2002-2009
In 2009, an estimated 22.5 million persons aged 12 or older were classified with substance dependence or abuse in the past year (8,9 percent of the population aged 12 or older).
-15.4 million were dependent on or abused alcohol but not illicit drugs. [68 percent of 22,5 million]
- 3.2 million were classified with dependence on or abuse of both alcohol and illicit drugs [14 percent]
- 3.9 million were dependent on or abused illicit drugs but not alcohol [17 percent]
(DPFT note: However, of the 3,9 million not currently abusing or addicted to alcohol, about 3.3 million had a previous history of alcohol abuse or addiction.
DPFT note: "Illicit drugs" includes prescription drug abuse. Excluding marijuana, prescription drug abuse is greater than the abuse of all prohibited drugs.
Many people addicted to illegal drugs (SUD) have concurrent alcohol addiction (AUD)
| Cocaine disorder | 79 % |
| Amphetamine disorder | 63 % |
| Opioid disorder | 58 % |
| Cannabis disorder | 58 % |
(from NESARC Tab 3):
Comorbidity between DSM-IV alcohol and specific drug use disorders in the United States: results from the National Epidemiologic Survey on Alcohol and Related Conditions
(NESARC) 2001-2002 survey by NIAAA
(From Table 3 )
|
||
| Any drug use disorder | 55 % | |
| Sedative use disorder | 40 % | |
| Tranquilizer use disorder | 58 % | |
| Opioid use disorder | 58 % | |
| Amphetamine use disorder | 63 % | |
| Hallucinogen use disorder | 79 % | |
| Cannabis use disorder | 58 % | |
| Cocaine use disorder | 79 % | |
| Solvent/inhalant | 60 % |
| Figure 7.1 Substance Dependence or Abuse in the Past Year among Persons Aged 12 or Older: 2002-2013 "In 2011, an estimated 20.6 million persons aged 12 or older were classified with substance dependence or abuse in the past year (8.0 percent of the population aged 12 or older) (Figure 7.1). Of these, 2.6 million were classified with dependence or abuse of both alcohol and illicit drugs, 3.9 million had dependence or abuse of illicit drugs but not alcohol, and 14.1 million had dependence or abuse of alcohol but not illicit drugs." |
||||||||
 |
||||||||
| "In 2009, an estimated 22.5 million persons aged 12 or older were classified with substance dependence or abuse in the past year (8.9 percent of the population aged 12 or older) (Figure 7.1). Of these, 3.2 million were classified with dependence on or abuse of both alcohol and illicit drugs, 3.9 million were dependent on or abused illicit drugs but not alcohol, and 15.4 million were dependent on or abused alcohol but not illicit drugs." | ||||||||
|
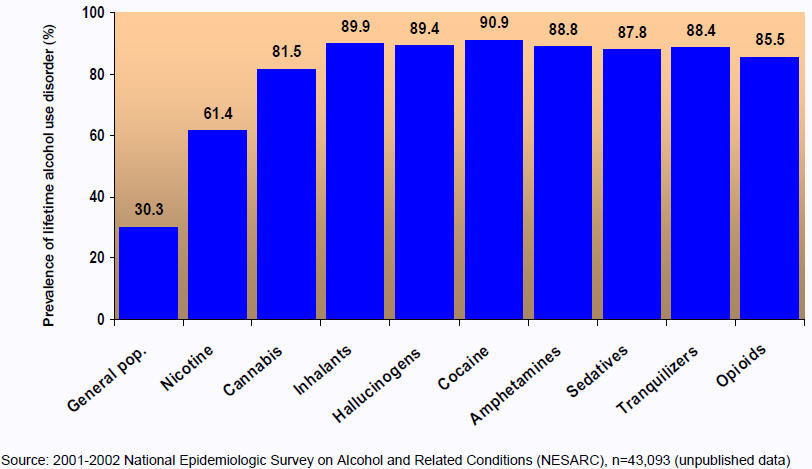
Prevalence of lifetime alcohol use disorder (AUD) among individuals with selected lifetime substance use disorders (SUD)
|
||||||||
 |
||||||||
From NIAAA / NESARC graph p. 9 at
Figure 7.2 Dependence on or Abuse of Specific Illicit Drugs in the Past Year among Persons Aged 12 or Older: 2013 |
||||||||
 |
||||||||
Figure 7.3 Illicit Drug Dependence or Abuse in the Past Year among Persons Aged 12 or Older: 2002-2013 |
||||||||
 |
||||||||
"Alcohol is the only psychoactive drug that in many individuals tends to increase aggressive behavior temporarily while it is taking effect." - The Panel on the Understanding and Control of Violent Behavior, National Academy of Sciences, 1994 (more at CRIME and DRUGS) Alcohol is more intoxicating than other drugs. Intoxication is the loss of mental or physical control and "crazed" behavior. This helps explain the frequent presence of alcohol "intoxification" in driving and boating accidents. Compare Addictive Properties of 6 Common Drugs, NIDA includes comparative intoxification. High-Risk College Drinking Consequences Every Year: students between the ages of 18 and 24 Death: 1,825 alcohol-related Injury: 599,000 unintentionally injured under the influence of alcohol Assault: 696,000 assaulted by student who has been drinking Sexual Abuse: 97,000 victims of alcohol-related SA or date rape Sex: 400,000 had unprotected sex Sex: 100,000 too intoxicated to know if they consented 3. Age is a critical factor in SUD. SUD peaks at age 21 at over three times the normal rate. About half of SUD is gone by age 26. There are very few new cases of problem use after age 30. No policy can produce any significant increase in adult drug abuse. Policy must focus on the period from birth to 21.
National Survey on Drug Use and Health (NSDUH). Data for 2010 :
|
| Age Category | TYPE OF ALCOHOL USE |
|---|---|
| Heavy Alcohol Use | |
| 2006 | |
| 12 | * |
| 13 | 0.5 |
| 14 | 0.7 |
| 15 | 1.7 |
| 16 | 4.5 |
| 17 | 6.7 |
| 18 | 12.8 |
| 19 | 14.4 |
| 20 | 14.0 |
| 21 | 19.5 |
| 22 | 17.3 |
| 23 | 17.2 |
| 24 | 16.1 |
| 25 | 13.2 |
| 26-29 | 11.9 |
| 30-34 | 8.4 |
| 35-39 | 7.3 |
| 40-44 | 6.7 |
| 45-49 | 7.0 |
| 50-54 | 6.7 |
| 55-59 | 4.6 |
| 60-64 | 2.7 |
| 65 or Older | 1.6 |
Extract. For full chart see Charts, Table G.20
| Figure 2.5 Past Month Illicit Drug Use among Persons Aged 12 or Older, by Age: 2010 and 2011 |
 |
| 4. Recovery from abuse and dependence is normal. There are dramatic increases in abuse and dependence from ages 18 to 21 and dramatic rates of recovery from 21 to 25. Despite over 7 million new drug users each year, rates of abuse and dependence have been stable for at least the eight years from 2002 through 2009. |
Despite some 3 million new illicit drug users (includes prescription drug abusers) each year the rates of abuse do not change much. The same is true of the 4.3 million new users of alcohol each year.
" ... a striking and unexpected finding from NESARC is that 72 percent of people who develop alcohol dependence in their lives have a single episode lasting 3 to 4 years on average, after which it goes away and does not recur (Hasin et al. 2007). " http://pubs.niaaa.nih.gov/publications/arh40/55-63.htm
National Survey on Drug Use and Health (NSDUH). Data for 2005 :
"There were no changes between 2002 and 2005 in the percentages of persons with dependence on or abuse of illicit drugs (3.0 percent in 2002 and 2.8 percent in 2005) and dependence on or abuse of alcohol (7.7 percent in 2002 and 7.7 percent in 2005).
The overall rate of current illicit drug use among persons aged 12 or older in 2005 (8.1 percent) was similar to 2002 (8.3 percent)."
The figures below show that only a very small fraction of those who say the drugs are "easy to get" actually use the drugs. "Availability" is generally higher now than in 1975 but even a huge decrease in supply would have left far more drugs available than was needed to meet the demand.
| Availability | Use In Past Month | 2002 - 2006 | ||
| 1975 | 2006 | age : 12 to 17 | 18 to 25 | |
| Marijuana | 88% | 85% | 7.5% | 16.5% |
| Cocaine | 37% | 47% | 0.5% | 2.2% |
| Heroin | 24% | 27% | 0.1% | 0.2% |
NAS also pointed out the market "gateway" of prohibition:
"Another major cost of attempts to prohibit the supply of marijuana is related to the fact that many illegal sellers of marijuana also sell other illegal drugs, e.g., PCP, amphetamine, and barbiturates (Blum, 1971). It is likely, therefore, that prohibition of the supply of marijuana increases access to and use of other illegal drugs through the creation of an illegal marketing system for all drugs." ... "It is clear, however, that there are many small-scale marijuana dealers, that many sellers service only their friends and acquaintances, and that those who sell marijuana are thereby more likely to come into contact with users and sellers of more dangerous drugs, to use such drugs, and to make them available to their clientele (Blum, 1971)."
"Moreover, there is reason to believe that marijuana sellers may become socialized into other illegal activities."
http://www.druglibrary.org/schaffer/library/studies/nas/markets.htm
"We believe, further that current policies directed at controlling the supply of marijuana should be seriously reconsidered. The demonstrated ineffectiveness of control of use through prohibition of supply and the high costs of implementing such a policy make it very unlikely that any kind of partial prohibition policy will be effective in reducing marijuana use significantly below present levels."
http://www.druglibrary.org/schaffer/library/studies/nas/conclusions.htm
An Analysis of Marijuana Policy
National Research Council of the National Academy of Science, 1982
http://www.druglibrary.org/schaffer/library/studies/nas/AMPMenu.htm
![]()
200 + 18 % 9 % 15 %
This also applies to the young as seen below..
The National Drug Threat Assessment of 2005 reported that all drugs are readily available throughout the country. Fortunately, very few of us are at all interested in using them and are therefore blissfully unaware of how easy it is to obtain them.
http://www.usdoj.gov/ndic/pubs11/12620/index.htm
8. Marijuana has an especially vital and unique place in discussions of drug policy.
The importance of marijuana prohibition is about a great deal more than the drug itself. Some 100 million users combined with inflated prices have produced an enormous market.
b) Marijuana enforcement places an enormous burden on our courts and police reducing their effectiveness and misallocating resources. This too increases our vulnerability to violent crime. (more below)
In Charts: Types of Illicit Drug Use in the Past Year among Persons Aged 12 or Older: Percentages, 2002-2009 we see that marijuana is used far more than all other prohibited drugs combined.
"... the prevalence of marijuana use among [adolescents] was still considerably higher in 2003 than in 1991... Use among young adults increased overall since 1991, not peaking until 2002."
"Preliminary interagency estimates suggest that anywhere from 12,000 to 25,000 metric tons of marijuana, including domestic and foreign, were available in the United States in 2002, up from an estimated 10,000 to 24,000 metric tons in 2001. These estimates are speculative. While current estimates are not precise, these ranges nevertheless underscore the magnitude of marijuana's availability in the United States and indicate that the amount available is increasing. ... production in the United States could range from 6,000 to 19,000 metric tons annually."
Moreover, these arrests do not deter use except to a minor extent among the more casual users.
See: Comparisons of Dutch and US marijuana policy
and
9. Comparisons of other drugs with alcohol provide a vital missing dimension in discussions of drug policy.
U.S. officials are determined to avoid comparisons with alcohol, which is arguably the most dangerous of the drugs. This deprives the public of their most logical basis for assessing other drugs. Alcohol is always readily available and most who are dependent on prohibited drugs are already dependent on alcohol too. In view of 2. above, it seems clear that a policy that does not emphasize alcohol abuse (and teen age vulnerability, 3. above) cannot have any significant impact on drug abuse and dependence.
Alcohol also provides an example of the wide range of responses that occur among different users of the same drug. Defining what a drug "does" or "is" relies heavily on the dosage, the individual user, and the social setting surrounding use. This is true of all drugs, contrary to the mythology dominating discussions of drugs.
One point in the comparison below is that it is "intoxification," that defines the degree to which a drug causes the user to lose mental and physical control. Alcohol is a leading candidate for "worst drug" in this respect.
Two Independent Studies Of Drug Addiction: Henningfield, National Institute on Drug Abuse, and Benowitz [B], University of California at San Francisco, Ratings [Lowest number = most serious effect]
| Withdrawal | Reinforcement | Tolerance | Dependence | Intoxification | |
| Heroin | 2 |
2 |
1 |
2 |
2 |
| B | 2 |
2 |
2 |
2 |
2 |
| Alcohol | 1 |
3 |
3 |
4 |
1 |
| B | 1 |
3 |
4* |
4 |
1 |
| Cocaine | 4 |
1 |
4 |
3 |
3 |
| B | 3* |
1 |
1 |
3 |
3 |
| Nicotine | 3 |
4 |
2 |
1 |
5 |
| B | 3* |
4 |
4* |
1 |
6 |
| Caffeine | 5 |
6 |
5 |
5 |
6 |
| B | [5] |
5 |
3 |
5 |
5 |
| Marijuana | 6 |
5 |
6 |
6 |
4 |
| B | [6] |
6 |
[6] |
6 |
4 |
* = shared rank with another listed drug
[#] = ranking adjusted by DPFT to reflect lower shared rankings
DPFT Note: Other than some variations in the tolerance rankings, the two studies produced virtually identical results. The studies were cited in presentations to the Senate-House Task Force on National Drug Policy in 1996.
Withdrawal: Presence and severity of characteristic withdrawal symptoms.
Reinforcement: A measure of the substance's ability, in human and animal tests, to get users to take it again and again, and in preference to other substances.
Tolerance: How much of the substance is needed to satisfy increasing cravings for it, and the level of stable need that is eventually reached.
Dependence: How difficult it is for the user to quit, the relapse rate, the percentage of people who eventually become dependent, the rating users give their own need for the substance and the degree to which the substance will be used in the face of evidence that it causes harm.
Intoxication: Though not usually counted as a measure of addiction in itself, the level of intoxication is associated with addiction and increases the personal and social damage a substance may do.
The evidence in this entire section helps explain the ratings below:
The French National Institute of Health, INSERM, consulted with experts from other countries and rated drugs by their danger in 1998 at government request. They established 3 groups:
[a] "most dangerous" - heroin, alcohol, and cocaine
[b] "next most dangerous" - tobacco, amphetamines, and others
[c] "least dangerous" - cannabis [marijuana], since it has "low toxicity, little addictive power and poses only a minor threat to social behavior," and others
-- from "Alcohol as bad as heroin and worse than pot," Reuters, 6-16-98
The ‘overall harm’ table:
| 1 | alcohol | 72 |
| 2 | heroin | 55 |
| 3 | crack | 54 |
| 4 | crystal meth | 33 |
| 5 | cocaine | 27 |
| 6 | tobacco | 26 |
| 7 | amphetamine/speed | 23 |
| 8 | cannabis (marijuana) | 20 |
| <snip> |
Heroin, crack and crystal meth were the most harmful drugs to the individual.
Alcohol, heroin and crack were the most harmful to others.
Further analysis showed alcohol is almost three times as harmful as cocaine or tobacco.
More at
| Drug Policy Forum of Texas dpft.org. All Rights Reserved. |